 |
|||||
|

Chickpea Gene Coexpression Analysis
Weighted gene coexpression network analysis (WGCNA) analysis was performed for 13176 transcripts with variance >=1.5. A total of 24 modules (M1 to M24) were identified which were found to be correlated with different tissues.
Transcripts associated with modules: Excel (.xlsx)
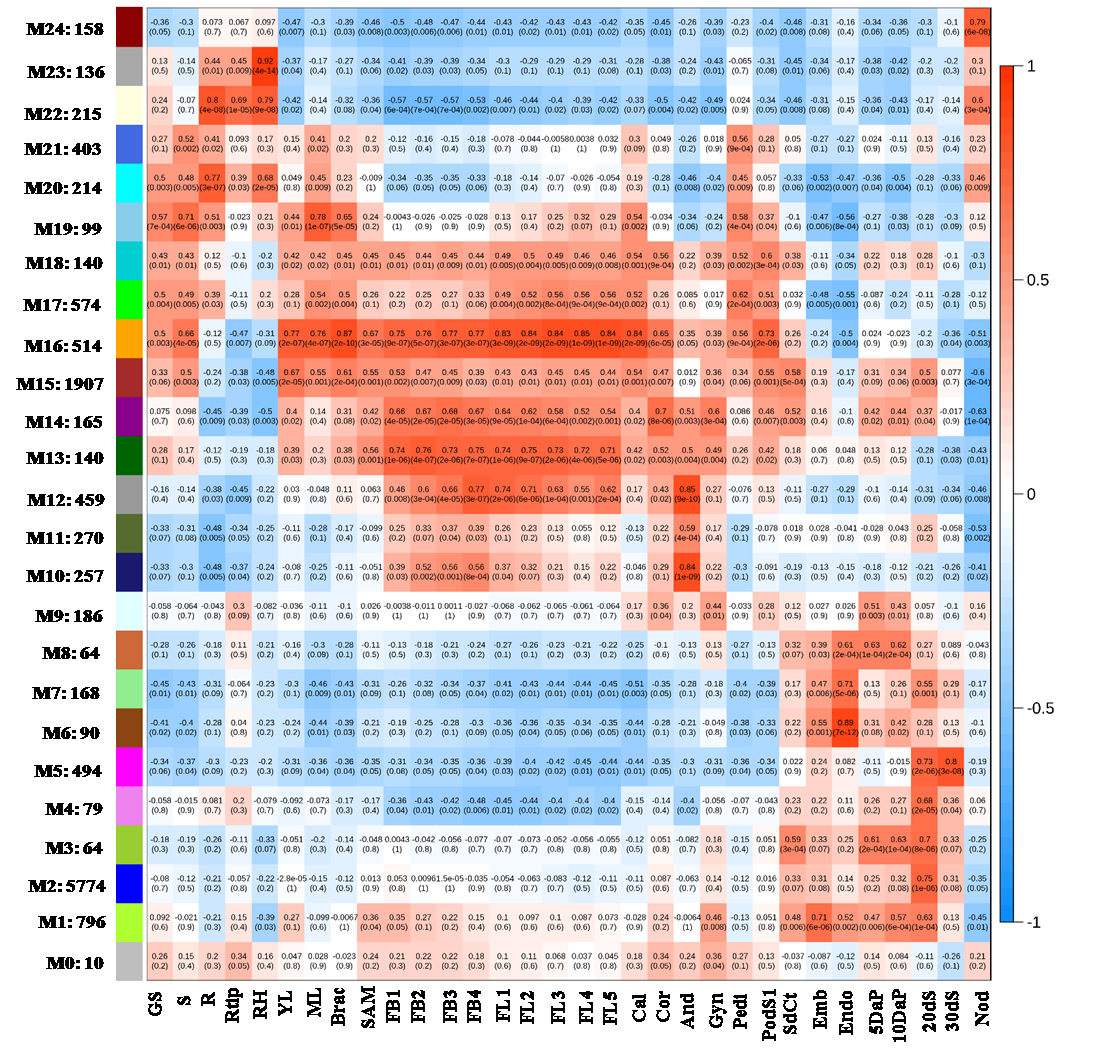
Heatmap showing correlation of each module (M1 to M24) with different tissue samples. Each cell corresponds to correlation coefficients and P-value stated in brackets. The correlation values are shown in color scale and also corresponds to cell color: blue and red color represents negative and positive correlation respectively.
Reseachers who find this database useful in their research, please cite our recent publication:
| Jawaharlal Nehru University, New Delhi, India |